Chronic Rhinosinusitis With Nasal Polyps Does Not Affect the Association Between the Nasal Provocation Test and Serum Allergen-Specific Immunoglobulin E Levels
Article information

Abstract
Background and Objectives
This study compared nasal provocation test (NPT) results between groups with and without chronic rhinosinusitis with nasal polyps (CRSwNP) to investigate whether CRSwNP affects the response to the intranasal allergen challenge.
Methods
We reviewed the medical records of patients who had undergone the NPT, multiple allergen simultaneous test (MAST), and paranasal sinus computed tomography. Patients were diagnosed with CRSwNP based on findings from nasal endoscopy and paranasal sinus computed tomography. The NPT for house dust mites was conducted, and a positive MAST diagnosis was determined when the levels of immunoglobulin E specific to Dermatophagoides farinae and Dermatophagoides pteronyssinus were equal to or greater than 2 positives or at least 0.70 IU/mL. We statistically analyzed the NPT results and their correlation with MAST outcomes, comparing the CRSwNP group to the non-CRSwNP group.
Results
Out of 99 participants, 30 had CRSwNP and 69 did not. There were no significant differences between the groups regarding MAST positivity, eosinophil count, eosinophil cationic protein levels, or responses to intranasal house dust mite challenges. The presence of CRSwNP did not significantly influence the correlation between NPT outcomes and MAST results.
Conclusion
The presence of CRSwNP did not influence the outcomes of the NPT or its correlation with the results of the MAST. Additional large-scale, longitudinal studies are warranted to validate these findings.
INTRODUCTION
Rhinosinusitis is a widespread condition globally, resulting in considerable healthcare costs and loss of productivity. Chronic rhinosinusitis (CRS) is characterized by the persistence of rhinosinusitis symptoms for 12 weeks or longer [1]. Historically, CRS has been classified based on the presence or absence of nasal polyps—a phenotypic trait—into CRS with nasal polyps (CRSwNP) and CRS without nasal polyps [2]. However, recent evidence indicates that this binary classification may not fully capture the complexity of CRS prognosis and fails to account for the diverse endotypes of the disease. It is now recognized that CRS is a multifaceted and heterogeneous condition with distinct phenotypes and endotypes. The current approach to classifying CRS begins with identifying its etiology and anatomic distribution, and then determining whether there is type 2 inflammation [3]. Type 2 inflammation in CRS, characterized by the presence of eosinophils in the sinonasal tissues, is referred to as eosinophilic CRS [4]. The incidence of eosinophilic CRS is on the rise in Asia, mirroring a global increase [4]. Notably, it is not only the eosinophil count that is elevated in nasal polyp tissues but also the levels of total immunoglobulin E (IgE) and specific IgE to inhalant allergens. Furthermore, there is a significant correlation between total IgE levels, eosinophil count, and eosinophil cationic protein (ECP) levels [5].
Allergic rhinitis (AR) is diagnosed by combining evidence of allergic sensitization with clinical symptoms, and it is characterized by inflammation driven by eosinophils. Although AR can occur as an isolated condition, it is theorized that its presence may aggravate CRS by amplifying the inflammatory response. Therefore, it is necessary to understand the interplay between CRSwNP and AR in the field of rhinology. Allergic sensitization, determined through skin prick testing, has been observed in up to 54% of patients with CRSwNP [6]. In human nasal tissues, IgE present in nasal polyp tissues is functional and capable of initiating immune responses, such as the activation of mast cells. Importantly, specific IgEs have been detected in nasal polyp tissues, regardless of their levels in serum [7].
The nasal provocation test (NPT) involves introducing a suspected causative antigen into the nasal mucosa and observing clinical reactions in a controlled and standardized manner. This assessment encompasses nasal secretions and symptoms such as itching and sneezing, with particular attention to nasal obstruction and potential ocular, bronchial, cutaneous, and systemic reactions [1,8]. The NPT is widely utilized in the diagnosis of AR as a confirmatory test to identify the antigen responsible for subjective symptoms, making it a critical component in the diagnosis of AR. The outcomes of the NPT show a significant correlation with those of the skin prick test and serum allergen-specific IgE levels. Therefore, combining the NPT with either the skin prick test or serum antigen-specific IgE measurements can improve the detection of relevant allergens and increase the diagnostic precision for AR [9].
Given this background, we hypothesized that the presence of CRSwNP could influence NPT results. A previous study demonstrated that responses to a nasal grass pollen challenge were diminished in AR patients with CRSwNP compared to those without CRSwNP. In that study, allergic rhinitis was diagnosed using the skin prick test, and participants were divided into four groups: CRSwNP patients sensitized to grass pollen, AR patients sensitized to grass pollen, control patients, and CRSwNP patients without grass pollen sensitization. However, the study was limited by its small sample size, with only 12 patients in each group, which calls for further research to confirm the findings [10]. Since the effect of CRSwNP on NPT outcomes with house dust mites has not been reported in Asian populations, our study aimed to assess the impact of CRSwNP on NPT results using house dust mites.
METHODS
Ethical considerations
This study was conducted in compliance with the World Medical Association’s Declaration of Helsinki. The study protocol received approval from the Institutional Review Board of Chung-Ang University Hospital (2204-013-19414). Due to the retrospective design of the study, the requirement for informed consent was waived.
Participants
This retrospective study was conducted at a single tertiary hospital. We reviewed the electronic medical records of potential participants who underwent the MAST, the NPT, and paranasal sinus computed tomography scans at Chung-Ang University Hospital between January 2020 and February 2022. Data were obtained retrospectively by examining existing results. We diagnosed CRSwNP based on findings from nasal endoscopy and paranasal sinus computed tomography, and we conducted the NPT using house dust mite allergens. House dust mites are major allergens in AR, with the European house dust mite (Dermatophagoides pteronyssinus) and the American house dust mite (Dermatophagoides farinae) being significant antigens that cause allergic inflammation [11]. Therefore, we used a mixture of D. pteronyssinus and D. farinae allergens for the NPT. The MAST was performed using the AdvanSure allergy screen test (LG CHEM, Seoul, Korea). ECP levels were measured using the Phadia 250 (Thermo Fisher Scientific Inc., Waltham, MA, USA; detectable range: 2–200 U/mL; the normal ECP serum level in healthy adults is below 14.9 U/mL). Each participant provided a 5 mL venous blood sample, which was collected aseptically and stored in vials containing EDTA and serum separating tubes. The study used the Sysmex XN-1000 (Sysmex Corporation, Kobe, Japan) automated hematology analyzer to perform a complete blood count, including an eosinophil count. Positivity for MAST to D. pteronyssinus and D. farinae was defined based on the following criteria: a high serum titer (≥2 positives or ≥0.70 IU/mL) of IgE antibodies against D. farinae and D. pteronyssinus [12]. Additionally, serum eosinophil counts and ECP levels were recorded.
All patients completed a visual analog scale (VAS)-based questionnaire that assessed rhinitis symptoms, including nasal obstruction, rhinorrhea, sneezing, and itching. A standardized 10-cm VAS ruler was utilized for this purpose. The subjective discomfort score was determined by summing the scores for each rhinitis symptom, with the score for each symptom ranging from 0 to 40 (0: no symptoms, 40: most troublesome).
Subjects with a history of using antihistamines in the last week, intranasal steroids in the past month, or systemic corticosteroids in the preceding 3 months did not undergo the NPT and were thus excluded from the study. None of our subjects had congenital anomalies or systemic conditions such as asthma, malignancy, or immunosuppressive diseases (Supplementary Fig. 1 in the online-only Data Supplement).
Nasal provocation test
Setting up the NPT
The NPT was performed following a previously reported protocol in an isolated environment [13]. The laboratory environment was controlled to maintain a constant temperature (20°C±1.5°C) and humidity (40%–60%). A solution of D. pteronyssinus and D. farinae (#6691, HollisterStier Allergy, Spokane, WA, USA) was obtained and diluted by mixing with normal saline at a 1:10 ratio. Saline was used to evaluate nonspecific hyperreactivity. We sprayed 100 μL of saline or D. pteronyssinus/D. farinae solution into both nostrils using a dispenser equipped with a metered-dose pump. The procedures of the NPT were performed following previous reports with minor modifications [13,14].
NPT outcomes
Subjective AR discomfort levels were assessed using a standardized 100-mm VAS ruler. The total nasal symptom score was calculated by summing the individual discomfort scores, with potential totals ranging from 0 (indicating no symptoms) to 500 (indicating the most severe symptoms). As an objective measure, peak nasal inspiratory flow (PNIF) was recorded using an inspiratory flow meter (Clement Clarke International, Harlow, UK). Baseline assessments for both subjective and objective outcomes were conducted prior to the test. A saline solution was administered as a spray into both nostrils. After a 10-minute interval, measurements were taken to evaluate nonspecific hypersensitivity. Subsequently, assessments were performed 15 minutes following the administration of the D. pteronyssinus and D. farinae solution. The change in the VAS score was determined by subtracting the baseline VAS from the post-challenge VAS. The change in PNIF was calculated using the formula: [(baseline PNIF)–(post-challenge PNIF)]/(baseline PNIF)×100 (%). A positive response was defined as a VAS change of ≥55 mm and/or a PNIF change of ≥40% at 15 minutes post-challenge [14].
Statistical analysis
Variables are presented as mean±standard deviation. The occurrence rate was measured for subjects, sex variables, and nonspecific hyperreactivity. The two-sample t-test was used to evaluate differences in ratios between the groups. The Wilcoxon rank-sum test assessed intergroup differences. Receiver operating characteristic (ROC) curve analysis was utilized for model comparisons, and the area under the curve (AUC) was analyzed. An AUC greater than 0.5 indicated a significant association, consistent with the results of the Wilcoxon rank-sum test [15]. DeLong’s test was employed to compare two ROC curves between the CRSwNP(-) and CRSwNP(+) groups [16]. To determine whether CRSwNP influenced the relationship between NPT and MAST results, we considered the following logistic regression model: logit(y)=β1χ1+β2χ1χ2=(β1+β2χ2)χ1, where y is the MAST value, χ1 is the NPT score, χ2 indicates the presence of CRSwNP, β1 represents the relationship between the MAST and NPT assuming no CRSwNP, and β2 is an additive effect for patients with CRSwNP. Two multivariate logistic regression models were trained for the MAST. In one model, χ1 denoted subjective AR symptoms, while in the other, χ1 referred to PNIF. The odds ratio and statistical significance of selected exposure variables were described. A p-value <0.05 was considered statistically significant. R version 3.6.2 (R Foundation for Statistical Computing, Vienna, Austria) was used for all statistical analyses.
RESULTS
Participants
Of the 99 patients enrolled in this study, 30 were diagnosed with CRSwNP, while 69 were not diagnosed with CRSwNP. In the CRSwNP and non-CRSwNP groups, 18 and 35 participants, respectively, were men. The mean age was 53.30±13.96 years in the CRSwNP group and 40.03±18.53 years in the non-CRSwNP group (p=0.001). The VAS score for rhinitis symptoms was significantly higher in the non-CRSwNP group (10.57±8.12 in the CRSwNP group vs. 14.89±8.48 in the non-CRSwNP group, p=0.012). Among VAS score subsets for rhinitis symptoms, itching was the only symptom that showed a significant difference between the CRSwNP and non-CRSwNP groups. Twenty percent of patients with CRSwNP (6 of 30) were MAST-positive, while 30.4% (21 of 69) were MAST-positive in non-CRSwNP group; this difference was not statistically significant. The serum ECP level was 22.85±21.13 μg/L in the CRSwNP group and 15.33±13.65 μg/L in the non-CRSwNP group. The serum eosinophil count was 395.53±248.82 cells/μL in the CRSwNP group and 220.26±151.09 cells/μL in the non-CRSwNP group. No intergroup differences were observed in the mean ECP level and eosinophil count. In the CRSwNP and non-CRSwNP groups, 6.67% (2 of 30) and 5.88% (4 of 69) of participants were diagnosed with nonspecific hyperreactivity, respectively; however, this difference was not statistically significant (Table 1).

Characteristics of the enrolled subjects
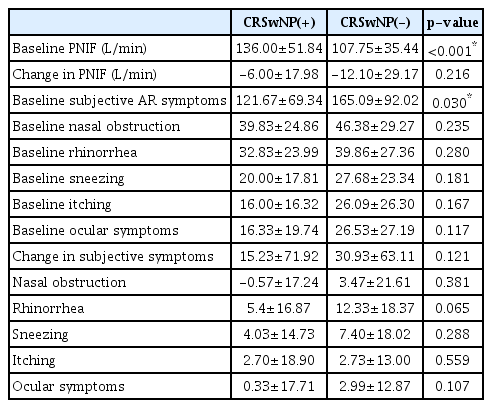
Nasal responsiveness to the house dust mite challenge in the CRSwNP and Non-CRSwNP groups
The baseline PNIF values before the allergen challenge were found to be 136.00±51.84 in the CRSwNP group and 107.75±35.44 in the non-CRSwNP group (p<0.001). The change in PNIF after intranasal house dust mite challenge showed no significant intergroup difference (p=0.216). The mean subjective total AR symptom scores, which included nasal obstruction, rhinorrhea, sneezing, itching, and ocular discomfort, were 121.67±69.34 in the CRSwNP group and 165.09±9.02 in the non-CRSwNP group; this difference was statistically significant (p=0.030). The change in the mean subjective total AR symptom score did not differ significantly between the groups (p=0.121) (Table 2).
Nasal provocation test result
Relationship between the results of the MAST and NPT
In the non-CRSwNP group, the ROC curve analysis for the change in PNIF based on the results of the MAST yielded an AUC value of 0.692 (p<0.05). Similarly, the ROC curve analysis for changes in subjective symptoms during the NPT based on the MAST results resulted in an AUC of 0.677 (p<0.05) (Fig. 1A). Among the subjective symptoms, sneezing had an AUC of 0.720 (p<0.05), and ocular symptoms had an AUC of 0.635 (p<0.05) according to the MAST results (Fig. 1B). In the CRSwNP group, the ROC curve analysis for PNIF changes based on the MAST results yielded an AUC of 0.795 (p<0.05), and the ROC curve analysis for changes in subjective symptoms during the NPT based on the MAST results resulted in an AUC of 0.760 (p<0.05) (Fig. 2A). Of the subjective symptoms, itching had an AUC of 0.750 (p<0.05), and sneezing had an AUC of 0.736 (p<0.05) based on the MAST results (Fig. 2B). Finally, we used logistic regression analysis to investigate whether the presence of CRSwNP influenced the relationship between the NPT and MAST results. We found that both PNIF and subjective NPT were significantly associated with MAST results, with odds ratios of 1.014 (95% CI; 1.004–1.025) and 1.039 (95% CI; 1.016–1.063), respectively. However, CRSwNP did not have an additional effect on the relationship between NPT and MAST results (odds ratios: 1.007 [95% CI; 0.983–1.032] for PNIF and 1.032 [95% CI; 0.972–1.096] for subjective AR symptoms) (Table 3). We also conducted the DeLong test to evaluate the difference in ROC curves based on the presence of CRSwNP, and we found significant differences in ROC curves between the CRSwNP(-) and CRSwNP(+) groups, as shown in Figs. 1 and 2. Likewise, no statistically significant differences were observed in the ECP level, eosinophil count, and subjective and objective NPT (with corresponding p-values of 0.913, 0.187, 0.619, and 0.434, respectively). Similarly, no statistical significance was found for nasal obstruction, rhinorrhea, sneezing, itching, and ocular symptoms (with p-values of 0.9468, 0.378, 0.923, 0.205, and 0.229, respectively).
Receiver operating characteristic (ROC) curve result for the nasal provocation test (NPT), eosinophil cationic protein (ECP) level, and eosinophil count in patients without chronic rhinosinusitis with nasal polyp (CRSwNP). A: ROC curve result for the NPT, ECP level, and eosinophil count. B: ROC curve result for subjective symptoms during the nasal provocation test (NPT). The area under the curve (AUC) was measured and compared with the results of the multiple allergen simultaneous test (MAST). An AUC >0.5 signifies a significant association, in line with the Wilcoxon rank-sum test. *p<0.05.

Receiver operating characteristic (ROC) curve result for the nasal provocation test (NPT), eosinophil cationic protein (ECP) level, and eosinophil count in patients with chronic rhinosinusitis with nasal polyp (CRSwNP). A: ROC curve result for the NPT, ECP level, and eosinophil count. B: ROC curve result for subjective symptoms during the NPT. The area under the curve (AUC) was measured and compared with the results of the multiple allergen simultaneous test (MAST). An AUC >0.5 signifies a significant association, in line with the Wilcoxon rank-sum test. *p<0.05.

Logistic regression analysis for the effect of CRSwNP on the relationship between the results of the NPT and MAST
DISCUSSION
We investigated the clinical response to an intranasal allergen challenge with house dust mites in participants with and without CRSwNP. Our main findings are that the presence of CRSwNP did not influence the responsiveness to an intranasal house dust mite challenge, nor did it affect the correlation between the results of the NPT and the MAST for house dust mites. No significant differences were observed in the clinical responses to house dust mite challenges between participants with CRSwNP and those without CRSwNP.
AR is a chronic inflammatory disease where clinical and immunological responses to an intranasal allergen challenge can be influenced by various factors. For instance, repeated exposure to allergens can affect the immune response of the nasal mucosa. Connell observed that daily repeated allergen challenges resulted in increased responsiveness of the nasal mucosa [17]. However, other research has indicated that repeated allergen exposure may not alter the nasal mucosal allergic response, or it could even lead to decreased responsiveness [18,19]. It is suggested that the reaction to repeated allergen exposure could differ depending on several factors, such as the type or number of allergens and the time between challenges. Therefore, we proposed that CRSwNP might influence nasal responsiveness following an intranasal allergen challenge in patients with AR and could modify the correlation between the results of the NPT and the MAST. However, our study did not reveal any significant differences in the NPT results or their association with the MAST between patients with and without CRSwNP. In line with our results, nasal polyposis did not impact the NPT outcomes when challenged with histamine in a prior study [20]. Nonetheless, it has been pointed out that the NPT results with grass pollen are reduced in patients with CRSwNP [10]. There is a lack of research on the clinical effects of CRSwNP on nasal responsiveness after an intranasal allergen challenge, and many previous studies have had relatively small sample sizes. Further research with an adequate number of participants is necessary to reach definitive conclusions. A longitudinal study that compares NPT results before and after endoscopic sinus surgery in patients with CRSwNP could offer valuable insights. Additionally, obtaining specific NPT data from the areas where nasal polyps are present might shed more light on the direct link between nasal polyposis and the NPT.
Interestingly, we found that the subjective AR symptom score was lower in the CRSwNP group than in the non-CRSwNP group (Table 2). Although the prevalence of MAST positivity, similar to the prevalence of AR, was consistent between the CRSwNP and non-CRSwNP groups, patients with CRSwNP reported fewer subjective AR symptoms. Our subjective AR symptom questionnaire asked participants about their experiences with nasal obstruction, rhinorrhea, sneezing, itching, and ocular discomfort. We hypothesize that CRSwNP patients, having endured nasal discomfort continuously over a longer period, might experience less subjective discomfort from intermittent AR symptoms. We suggest that the subjective AR symptoms in CRSwNP patients may be weakly associated with the results of diagnostic tests. Additionally, as shown in Table 2, the baseline PNIF was significantly higher in the CRSwNP group than in the non-CRSwNP group. This suggests the possibility that nasal patency was indeed better in the CRSwNP group than in the non-CRSwNP group. Therefore, objective tests should be actively recommended for CRSwNP patients, irrespective of AR symptoms.
Nonspecific hyperreactivity is diagnosed when nasal symptoms are exacerbated by exposure to nonspecific, nonallergenic triggers such as sudden temperature changes, cold air, and fragrances [21]. We found that fewer than 10% of participants (6.67% in the CRSwNP group and 5.88% in the non-CRSwNP group) were diagnosed with nonspecific hyperreactivity. There was no significant difference in the prevalence of nonspecific hypersensitivity between the CRSwNP and non-CRSwNP groups. Nonspecific bronchial hyperresponsiveness appears to be unaffected by nasal polyposis [22]. Furthermore, nonspecific bronchial hyperresponsiveness did not influence the progression of nasal polyposis or the surgical treatment outcomes for nasal polyposis [23]. However, it has been reported that the risk of developing CRSwNP differs between patients with localized allergic rhinitis and those with generalized allergic rhinitis [24]. We propose that the relationship between CRSwNP and nonspecific nasal hypersensitivity warrants further investigation.
Our study had several limitations. First, the subjects were divided into two groups: MAST-positive and MAST-negative. Since the skin prick test was not administered to all participants, we relied solely on the MAST test results to determine the presence of AR. Although previous research has indicated that the MAST has a reliable diagnostic value and its outcomes are closely correlated with those of the NPT [9,25], we cannot dismiss the possibility that the relationship between the NPT results and the skin prick test might vary between patients with CRSwNP and those without. Additionally, the MAST results may not accurately reflect the actual presence of AR. Second, our study only included subjects sensitized exclusively to house dust mite allergens, without considering other allergens such as grass pollen or dog hair. House dust mites are one of the most common aeroallergens in South Korea, with European house dust mites (D. pteronyssinus) and American house dust mites (D. farinae) being the primary species of concern in allergic reactions [11,26]. Moreover, we did not account for other types of house dust mite allergens that may be relevant [27].
We cannot rule out the possibility that the relationship between the results of the NPT and MAST could vary by allergen type. Therefore, larger studies evaluating various types of allergens need to be conducted to support our preliminary hypothesis. Third, we did not classify CRS based on severity. The presence of nasal polyps does not correlate with the severity of CRS. We cannot rule out the possibility that classifying CRS based on severity—for example, using the Lund-Mackay score—might lead to different effects of CRS on NPT results between mild and severe CRS patient groups. Moreover, we administered allergens to both nostrils, which deviates from the standard NPT protocol. As such, our findings require confirmation through prospective studies that adhere to the standard NPT protocol. Finally, the number of participants in this study was limited, particularly in the CRSwNP group. The study’s design, which was confined to only two groups, did not include comparative results with other groups, such as CRS patients without nasal polyps. Therefore, we acknowledge that our study design was insufficient to provide conclusive data on the relationship between the NPT and CRSwNP. To corroborate our results, large-scale population-based studies are recommended.
To our knowledge, this study is the first to compare the results of the MAST and NPT among patients with and without CRSwNP for house dust mite antigen extracts in a Korean population. We found that the presence of CRSwNP did not influence either the responsiveness of the NPT against house dust mites or the relationship of the objective and subjective results of the NPT with MAST positivity. However, due to the limitations of our study, we consider our results to be preliminary and not sufficient to form definitive conclusions. Further large-scale, population-based research is needed to overcome the shortcomings of our study, particularly regarding the antigen-specific responsiveness of the NPT in CRSwNP and the potential changes in NPT outcomes following eosinophilic sinus surgery in CRSwNP patients.
Supplementary Materials
The online-only Data Supplement is available with this article at https://doi.org/10.18787/jr.2024.00004.
Notes
Availability of Data and Material
This study’s data are available from the corresponding author upon reasonable request. The data are not publicly available.
Conflicts of Interest
Hyun Jin Min who is on the editorial board of the Journal of Rhinology was not involved in the editorial evaluation or decision to publish this article. All remaining authors have declared no conflicts of interest.
Author Contributions
Conceptualization: Hyun Jin Min. Data curation: Il-Youp Kwak. Formal analysis: Il-Youp Kwak. Investigation: HyoungSun Yoon, Hyun Jin Min, KyungSoo Kim. Methodology: KyungSoo Kim, Il-Youp Kwak. Project administration: Hyun Jin Min, KyungSoo Kim. Software: Il-Youp Kwak. Validation: Il-Youp Kwak. Writing—original draft: Hyun Jin Min. Writing—review & editing: Hyun Jin Min, KyungSoo Kim.
Funding Statement
None
Acknowledgements
None